back to the article index
Page feed
Visualization based on geographical mapping of the principle of the UniNetVerse theory
The UniNetVerse theory proposes the interconnection preceded the Internet and that consequently you can never be an isolated node of the network. Consequently you are always subjected to changes of topology of the network from anywhere at any moment and that only by understanding it's interconnected nature you can survive those chances.
Principle
- no disconnected networks on parallel dimension (mathematically speaking)
- but 1 interconnected network of networks
- thus 1 and only 1 network
See also monism in philosophy.
Expected result
- find strategical information
- by knowing your position in the network
- by finding the emerging trends
- thanks to analysis of evolution over time
Consequently you become a hub and are able to replace yourself based on the anticipated changes.
Producing such an automated tool would directly show how relevant the theory is and potentially provide a strategical advantage.
Realization
Data to gather
- N key strategic maps
- energy/energetic resource map (Sylvain and the book I sent him/Nora/Agathe for Areva China) : from Chevron 2007 (low resolution!) and Energy in the world. An international perspective by Bologna International Committee for the Cartography and the Analysis of Contemporary World
- financial flow map (Nicolas)
- logistic transit map (Guillaume/Pascaline)
- Computations (Laurent/Nicolas)
- Data Center Map by IDG TechNetwork
- brain drain (?) : from OECD in 2006
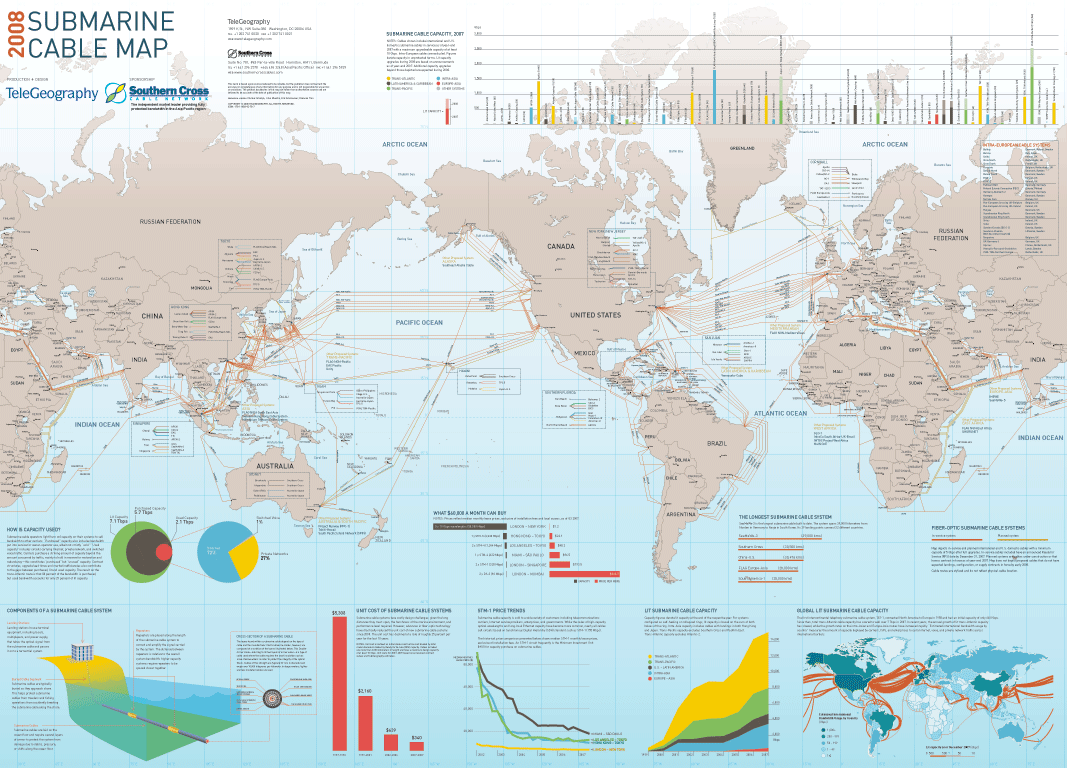
- information pipelines : traffic, submarine cables (older pdf) (?)
- Research (Paola) : Mapping unknown regions from Research Trends, Maps of Science dedicated website and also Places & Spaces: Mapping Science
- Biology : Metabolic_network
Method
- take N maps of key networks (ex : gas pipeline, underwater information cable, food logistic roads, ...) covering the same physical area (ex : the globe)
- put them as overlays of each other
- connect the map where they actually do connect
- have to define what a factor would be (beside financial links? human links? ...)
Visualization
- 5 maps with each one having a different color
- 1 set of 5 superposing maps
- 1 map of multiple colors
- analyze of this newly generated map
(Scalable svg version available)
Tools
- The Hyper-Layering, SVG MAP Lab, 2008
- OSGeo.org : support and build the highest-quality open source geospatial software.
- OpenLayers "makes it easy to put a dynamic map in any web page."
- GoogleMap
- Patallax for FreeBase (and other semantics tools for quick analysis)
- Link Array View in Starlight from PNNL
- Cartagen framework for dynamic mapping
- Polymaps free JavaScript library for making dynamic, interactive maps in modern web browsers.
GIS
- Quantum GIS (QGIS) : user friendly Open Source Geographic Information System (GIS)
- PostGIS (contraction de PostgreSQL et de GIS) : module spatial qui confère à PostreSQL le statut de SGDBRO spatial
- Wikimapia online editable map - you can describe any place on Earth.
- OpenStreetMap free editable map of the whole world.
- with its CloudMade Makes Maps Differently
- aims to continue the democratization of geo data and to expand access to open geo data through a range of simple yet powerful tools and APIs.
- GRASS GIS: Web services
- GeoHack modified version of the map sources from the gis extension by Egil Kvaleberg (used on Wikipedia)
- OpenLayers Free Maps for the Web
Parsing maps/GIS in CLI
graph traversal and text output
Motivation
- wasted time for rendering with GoogleMaps/OpenStreetMaps
- most of the time I just need some quick info
- impossibility to combine easilly
- text form allows to pipe and thus connect several networks that don't necessarly do so properly
See also
Inspired by
Inspiration
To integrate
Inspired by
- discussion with Raphael's brother-in-law during Emmanuel's wedding
Notes
- maybe today in a world where the intangible takes a bigger place, geography takes an even more crucial place since it is as important before but harder to see !
- going against "The World is Flat" theory? (eventually to link with http://mitworld.mit.eduideo/591


