Consumption of materials WithoutNotes
During the last 7 years, excluding books and research papers, as of early March 2016
- last articles I have read
- 5079 items
- 4649 read
- 430 watched
- 6383 notes (generally 1 line long)
In their titles 6 items have quantified self, 8 items with quantified and 76 with self.
added
in 1 sentence: ~3 years now with ~1 edit of ~5 words per daylight hour (as of July 2011)
to add and generate at the root
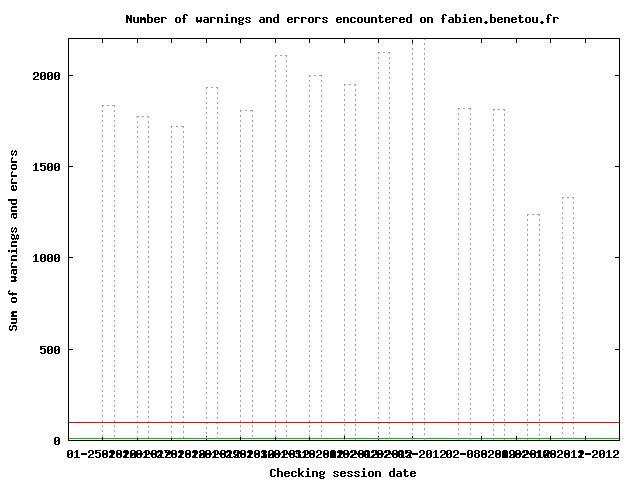
Number of errors
Number of pages
- 1490 pages
- with their pages viewed through the visit distributions since 18/02/2011
- see stats file from 15/02/2011 to 7/11/2010 and until 18022011 which included Robots.Txt as if it was a wiki page
- note that it includes my own viewing but now viewing before the 7th even though the content was available for years
- few events that can explain peaks
Number of edits
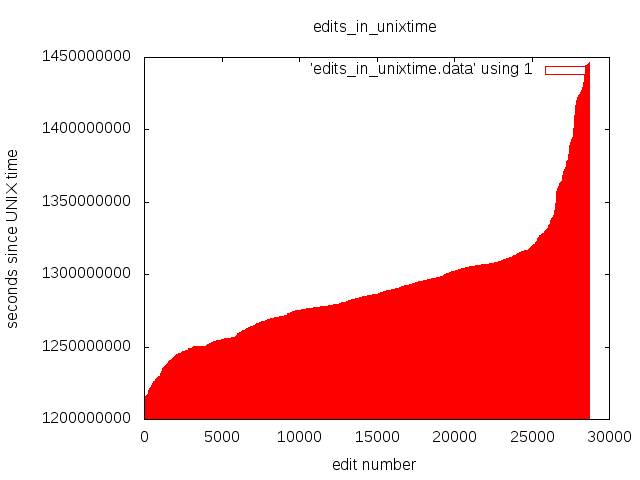
- 26K as of 22/01/2012
- past edits
23K as of 29/06/2011 21K as of 21/05/2011, 14K as of 11/09/2010
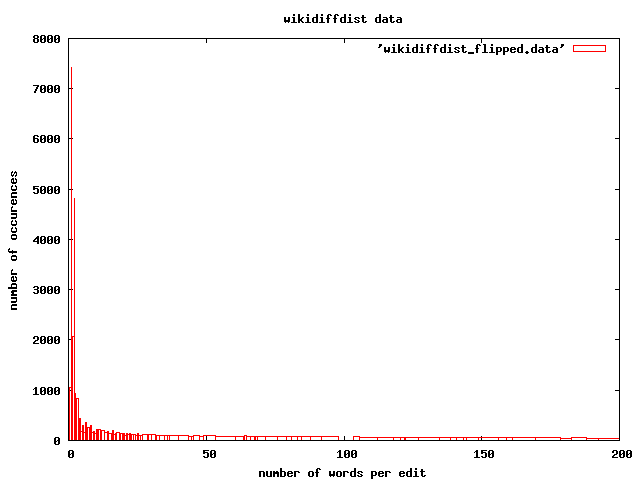
- with ~51 "words" per edit and peak at 5 words
- based on space this "1" or "a" would be a word too

bin/wiki_diff_distribution.sh

- distribution of top 10 authors by contributions as of 11/11/2010
Average number of edits per hour
- ~1 as of 22/01/2012
- 26000 / (((1327257767 - 1214268628)/3600)-(1307*8))
- ~1 as of 12/09/2010
- 14000 / (((1284233397 - 1214268628)/3600)-(810*8))
- unixepoch timestamps of start 1284233397 and current 1214268628 dates thus in seconds
- 810 number of days * 8 hours of sleep
- 14K is the number of edits
Size
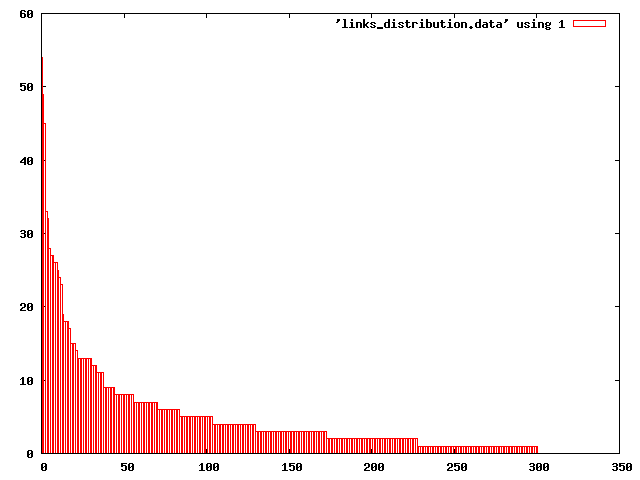
Number of internal links

- extrema, BackEnd and pages with 0 links, have been removed
ping statistics (from client in Paris)
- 40 packets transmitted, 40 received, 0% packet loss, time 39057ms
- rtt min/avg/max/mdev = 41.586/42.421/47.036/1.269 ms
Page generated time
Search through social logs
- Path:/pub/internal_measurements/socialmemorization_data.txt
- improvment
- track the moment of the day when the command is most often used
- pre-load before the next most likely moment
- naive version : 15min before average first daily access time
- more or less 15min depending on mdev and what is most likely to replace it in cache
Parsing time
- ~2m to render and simply parse across every page of every group
Resources

- vmstat
procs -----------memory---------- ---swap-- -----io---- -system-- ----cpu----
r  b   swpd   free   buff  cache   si   so    bi    bo   in   cs us sy id wa
0  0  43868  23000  78392 257892    0    0     1     0    0    0  3  0 95  2
- hdparm tests (as of 1283250693)
- sda1 / device read timings
- 14 MB in 3.28 seconds = 4.27 MB/sec
- sda1 / cached read timings
- 792 MB in 2.00 seconds = 395.85 MB/sec
- sda2 /home device read timings
- 18 MB in 3.14 seconds = 5.72 MB/sec
- sda2 /home cached read timings
- 778 MB in 2.00 seconds = 388.32 MB/sec
- see also
Entire "request" time study
- gather
- brain delay
- hand movement time
- ping
- DNS requests
- server-side generation time of page
- full page downloading time
- including JavaScript libraries
- client-side page rendering
- use
time wget URL --delete-after
- see also
--no-dns-cache and --no-cache
- allows to also see the retrieval time thus deduce part of the rest
- organize in a visually coherent manner
See also
 Fabien Benetou's PIM


