Ideas to go further
From personal use
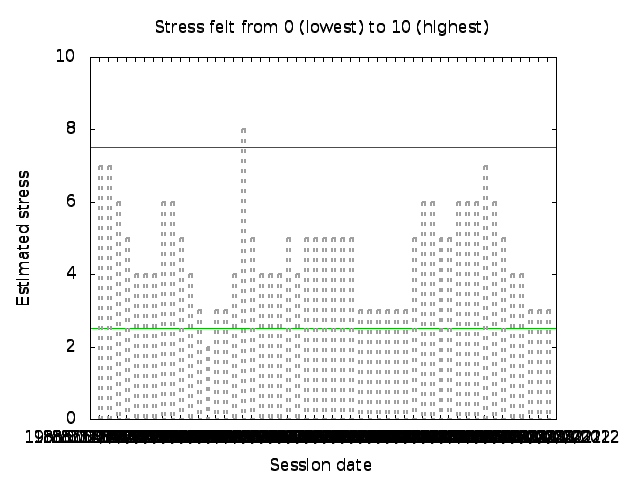
with histogram used instead of with boxes
- e.g.
- with gnuplot in crontab (with proper permission on the output image and absolute path)
- should be used for Numbers eventually with inotify instead
- How do I skip data points? in the official FAQ
- specifying ? as a data value
- set arrow from 0,0 to 1,1 to draw a unidirectional arrow from one point to another
- terminal do make a difference on the possible styles
- e.g. PostScript allow dashed and dotted lines while png or svg do not'
- set noytics and set noxtics to remove tics
- set ytics 0,1 to set tics at 0 and 1 value on y axis
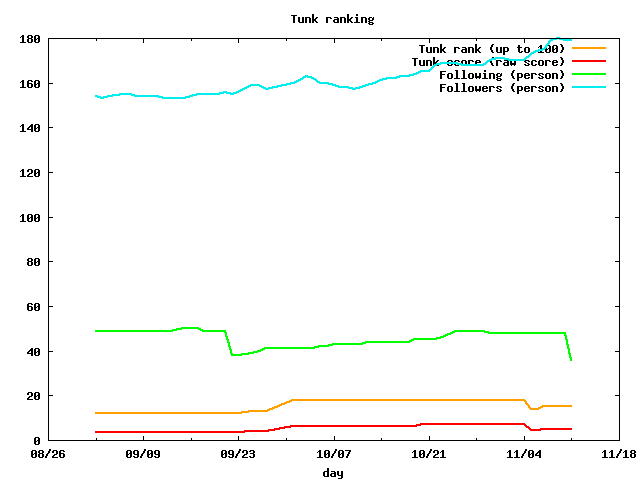
- set multiplot and set style line 1 lw 2 linecolor rgb "cyan" with plot [] [] 'tunkrank_data' using 1:2 with lines ls 3 ti "Tunk rank"
- set label "TheDarkSideOfGoogle" at 58,"31/08/10" rotate left
- plotting time series
- set timefmt "%H:%M"
- set ylabel "Hour"
- set xlabel "Session number"
- set boxwidth 1
- plot [0:] [] 'morning_p.data' using 1 with boxes
set label "crontab_listing" at first 336, first 0.05 : add a label at coordinates X,Y relative to the axis values
- note that all commands must be done before the plot command is used
set terminal png : render in a png format
set output "MyCurve.png" : output in a file in the current directory
- swimmingbars.plt and runningcurve.plt used for Exercises
- between interactive canvas, Octave, data.gov/DBpedia (SemanticWeb) why one would pay for Wolfram|Alpha with very hard to copy and mashup results?
- Draw a Bar-Graph
set boxwidth 1
plot [] [900:2600] 'swimmingdata' with boxes : use boxes style on the swimmingdata dataset with no specific range on the x axis and a specific range for the y axis
See also
To explore
Note
My notes on Tools gather what I know or want to know. Consequently they are not and will never be complete references. For this, official manuals and online communities provide much better answers.
 Fabien Benetou's PIM


